The home speaker industry spans smart speakers, soundbars, multiroom systems, home theater speakers, and broader home audio equipment. These home speaker industry statistics highlight current adoption, buyer behavior, market size benchmarks, and growth rates shaping the category in 2026.
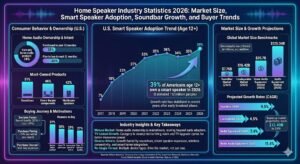
39% of Americans age 12+ own a smart speaker in 2026, representing an estimated 112 million people.
U.S. smart speaker ownership climbed from 7% in 2017 to 39% in 2026.
74% of U.S. adults own a home audio product, according to CTA research.
28% of U.S. adults purchased a home audio product in the past 12 months.
40% of U.S. adults plan to buy a home audio product in the next 12 months.
Soundbars are the most owned home audio product among U.S. adults at 51%.
Home theater components are owned by 46% of U.S. adults, while multiroom speakers reach 43%.
66% of recent home audio buyers say they buy in person.
Roughly 70% of recent buyers make their purchase within one month of first thinking about it.
Among recent home audio buyers, sound quality is the top decision factor at 52%, followed by cost at 49%.
The global soundbar market was valued at $7.79 billion in 2024 and is projected to reach $13.40 billion by 2030.
The global loudspeaker market is estimated at $16.42 billion in 2025 and projected to reach $20.49 billion by 2030.
The global audio equipment market was valued at $125.04 billion in 2025.
Future Market Insights estimates the global home audio equipment market at $35.7 billion in 2026.
Sonos reported $1.44 billion in fiscal 2025 revenue and says it is trusted by more than 17 million households in 60 countries.
U.S. smart speaker ownership trend
Smart speaker adoption in the U.S. has expanded sharply since 2017, although the growth rate has been much steadier in the last few years than in the category’s early breakout phase.
CTA’s home audio research shows that ownership is already mainstream in the U.S., while a sizable share of adults still expect to buy into the category again over the next year.
Label
Bar
Value
Own any home audio product
74%
Purchased in past 12 months
28%
Plan to buy in next 12 months
40%
Max = 74%. Widths: Own any home audio product 100.00%, Purchased in past 12 months 37.84%, Plan to buy in next 12 months 54.05%
Most-owned home audio product types in the U.S.
Soundbars lead ownership among the specific home audio product types CTA highlighted, showing how strongly TV-linked audio upgrades now anchor the market.
Label
Bar
Value
Soundbars
51%
Home theater components
46%
Multiroom speakers
43%
Max = 51%. Widths: Soundbars 100.00%, Home theater components 90.20%, Multiroom speakers 84.31%
Why people buy home audio products
Upgrading the sound experience is still the clearest trigger. The strongest reasons cluster around content enjoyment, pairing with a new TV, and creating a more immersive at-home listening experience.
Label
Bar
Value
Better enjoy content
37%
New TV purchase
30%
Immersive sound at home
29%
Poor TV speaker quality
27%
Max = 37%. Widths: Better enjoy content 100.00%, New TV purchase 81.08%, Immersive sound at home 78.38%, Poor TV speaker quality 72.97%
Selected market size benchmarks
These figures come from different research firms and use different category definitions, so they should be treated as scope benchmarks rather than numbers that can be added together.
Projected growth rates across speaker-related categories
Among the benchmarks used here, the fastest forecast belongs to home audio equipment, while soundbars also stand out for their relatively strong medium-term growth rate.
Label
Bar
Value
Soundbar CAGR
9.5%
Loudspeaker CAGR
4.5%
Audio equipment CAGR
7.4%
Home audio equipment CAGR
11.4%
Max = 11.4%. Widths: Soundbar CAGR 83.33%, Loudspeaker CAGR 39.47%, Audio equipment CAGR 64.91%, Home audio equipment CAGR 100.00%
What these home speaker industry statistics show
The home speaker industry has moved well beyond early-adopter territory. Smart speaker ownership is still growing, but the bigger story now is how broad home audio ownership has become across product types such as soundbars, components, and multiroom systems.
The data also suggests that the category is closely tied to the living room and TV upgrade cycle. Many buyers enter the market because they want better sound for the content they already watch, because they just bought a new TV, or because built-in TV audio does not feel immersive enough.
From a business perspective, growth is no longer coming from one single device format. Soundbars remain a major volume category, smart speakers continue to expand their installed base, and the wider audio equipment market is being supported by wireless connectivity, smart home integration, and higher consumer expectations for at-home entertainment.
Sources
Edison Research, The Infinite Dial 2026
Consumer Technology Association, Home Audio Market: A Customer’s Journey, 2024
Check out the 10 best party speakers that can transform your backyard gatherings into unforgettable experiences—your next celebration deserves the perfect soundtrack!
Bring your viewing experience to life with the 10 best soundbars for crystal clear dialogue—discover which models will ensure you never miss a word again!